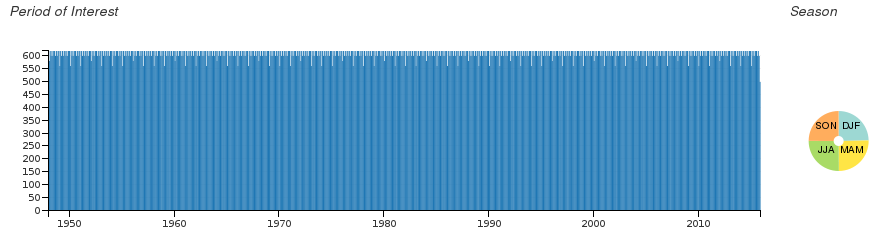
 Selection of the period of interest across the database year range at a monthly resolution. Click on the chart with the mouse to define a filter window.
 You can also filter by season or combination of seasons using the pie chart.
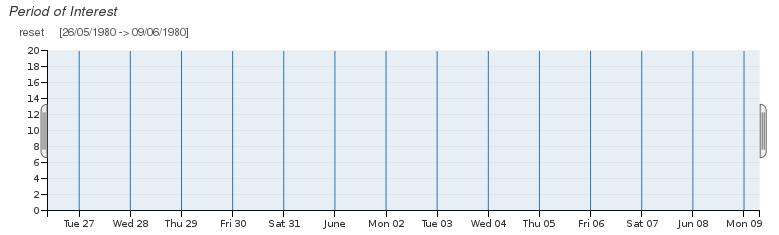 You can zoom on the chart with the mouse wheel to the resolution of a day. You can move the filter handles to adjust the window. To cancel the filter, click on "reset".
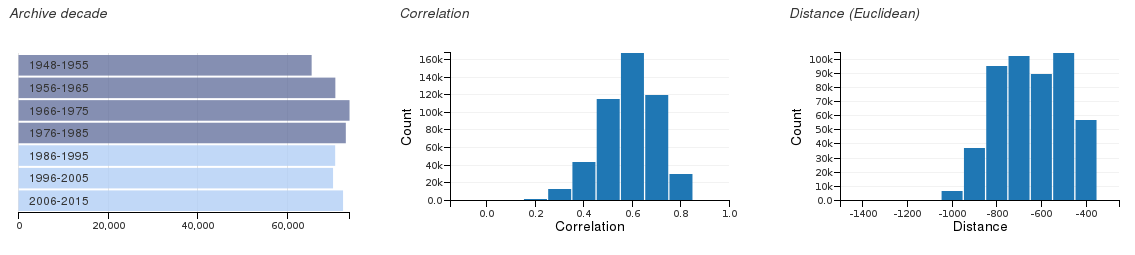 The counts of analogues retrieved for the selected period of interest are binned and displayed by decade, correlation and Euclidean distance.
Methods:
We assume that a trajectory of a dynamical system (or an ensemble of trajectories) is observed during a reference period R, and that this trajectory is a good proxy for the underlying attractor. For a distinct target time interval T, we determine, for each t in T, the states of the reference trajectory in R that are closest to the state reached at target time t in T. The closest states found during the reference R are called the analogues of the target T. There are several ways of obtaining closest analogues: by minimizing a distance or maximizing a correlation. The analogue determination hence strongly depends on the criterion to be optimized and there is no objective reason to prefer one method over another [Toth, 1991a], although the results can be different.
Here, we use the standard Euclidean distance and linear correlation that are adapted to mean variations. We select the first 20 "best" analogues.
See the A2C2 website for more information.
Technical architecture:
This application uses following JavaScript libraries:
- d3.js for Data-Driven Documents
http://d3js.org - crossfilter.js for Fast Multidimensional Filtering for Coordinated Views
http://square.github.io/crossfilter - dc.js for Dimensional Charting JavaScript Library http://nickqizhu.github.io/dc.js