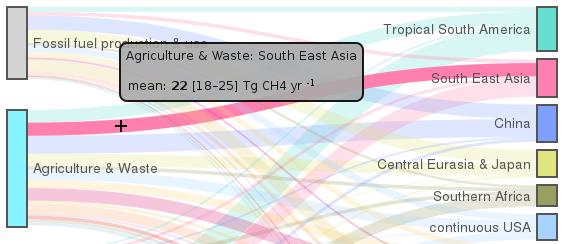
 Moving the mouse over regions or over their emission flows shows their relative contribution to the global methane budget in Tg CH4 yr-1 (mean values and the minimum-maximum range (mean [min, max])).
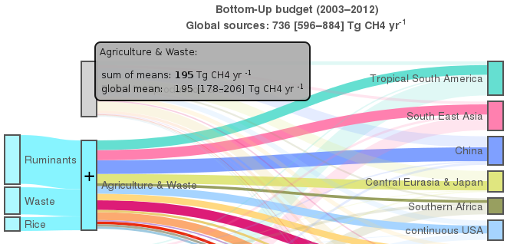 The total source estimates from the BU approach are further classed into finer subcategories.
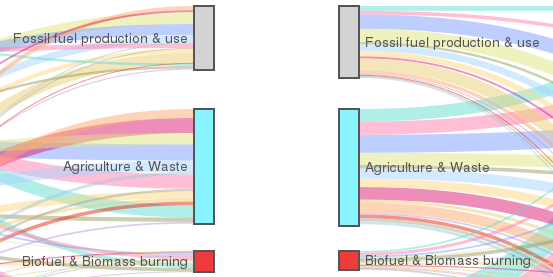 There is good consistency between TD (left) and BU (right) approaches in the partition of anthropogenic emissions between Fossil fuel production & use, Agriculture & Waste, and Biofuel & Biomass burning.
 The disequilibrium between TD (left) and BU (right) budgets is mainly due to natural sources which are difficult to constrain in TD and there are few measurements for BU. Some natural emissions are not yet available at a regional scale for BU (oceans, geological sources, inland waters), hence they are classified as Not (yet) spatially distributed.
Sources of methane:
Methane concentration increased in the atmosphere due to human-induced emissions from Agriculture & Waste (including livestock and rice paddies) and from Fossil fuel production & use (coal, gas and oil extraction). Other large emissions of CH4 come from wetlands, where the decomposition of organic matter at low oxygen levels favors the production of CH4 in flooded soils (instead of CO2 when there oxygen is available) and biomass burning during incomplete combustion. Additional emissions from geological processes, rivers and lakes are also important but these sources are not currently well understood.
Methane on the rise:
Methane is the second most important greenhouse gas contributing to human-induced climate change after carbon dioxide (CO2), and is also about 28 times more powerful. The latest scientific assessment by the Intergovernmental Panel on Climate Change [IPCC, 2013] states that CH4 concentrations have increased by 150% since the Industrial Era (compared with a 40% increase in CO2). After almost one decade of stable CH4 concentrations since the late 1990s, atmospheric measurements show renewed CH4 concentration growth since 2007 up to the present.
CH4 also contributes to the production of ozone in the lower atmosphere, with negative impacts on human health and natural ecosystems.
Tracking the dynamics of the CH4 budget and attributing the changes to processes, sources and regions has become fundamental for tracking climate change and exploring mitigation options to avert further global warming.
Ways to reduce methane:
Policies to reduce human-induced CH4 emissions can help in the short term to meet the global warming target of staying below a 2°C temperature increase relative to pre-industrial levels. Some ways to reduce CH4 emissions include: reducing leaks in the oil and gas sector, better management of coal mines for fugitive emissions, changing livestock diet, optimizing rice cultivation, and capturing CH4 from landfills and other decaying waste as biogas to replace fossil fuels.
OH radicals are natural cleaning agents in the atmosphere which permanently remove CH4 from emissions. If all CH4 emissions were stopped today, CH4 concentrations would decrease rapidly because the OH cleaning action, and CH4 concentrations would approach zero in about 9 years. This is why CH4 is a short-lived greenhouse gas, as opposed to the long-lived CO2 which stays in the atmosphere for centuries after emissions.
Global Carbon Project:
This visualization was developed as part of the Global Carbon Atlas, a web platform to explore and visualize the latest carbon and methane emission data available from the Global Carbon Project (GCP).
The data were obtained from a team of 80 GCP researchers who have produced a new assessment of the global CH4 budget which includes all natural and human emissions and how CH4 is destroyed in the atmosphere. The bottom-up approach used diverse data inventories, observations and models, including energy statistics, agricultural data, biogeochemistry modeling, and observation-driven approaches. The top-down approach used measurements of atmospheric CH4 concentrations at 100 stations around the world, interpreted with atmospheric inversion models.
As part of the scientific goals, members of the Global Carbon Project will further develop more complete and constrained CH4 budgets and provide regular updates.